How to Unminify JavaScript for Debugging (Readable Output)

How to Unminify JavaScript for Debugging (Readable Output)

Learn how to unminify minified JavaScript for debugging. Transform unreadable code into formatted, understandable code in just a few clicks with our free tool.

22.12.2025
7 min read
Share this article:
javascript
unminify
debugging
development
code
tools

The problem with minified code in production

You've probably encountered this situation: a JavaScript error appears in production, but the source code is minified and completely unreadable. Variables are renamed to `a`, `b`, `c`, spaces removed, comments erased. How do you debug in these conditions? The solution: unminify the code to make it readable and understandable.

Make minified code readable and formatted
Quickly identify errors in production code
Understand the behavior of a third-party minified library
Analyze legally obfuscated JavaScript code
Save time during debugging

Best practices for debugging minified code

Effective debugging strategies

Here are proven techniques for effectively debugging minified code:

Use Source Maps if available (best solution)
Unminify code with FastMinify for an overview
Use console.log() strategically to trace execution
Analyze the stack trace to identify the problematic function
Compare behavior between minified and non-minified code in development
Identifying problems in unminified code

Even with renamed variables, you can identify problems:

Look for recognizable code patterns (if/else, for loops, function calls)
Use literal values (strings, numbers) as landmarks
Analyze object and array structures
Follow function calls to understand flow
Use DevTools to inspect values at runtime

Why unminify JavaScript?

Common scenarios requiring unminification

Several situations will lead you to unminify JavaScript:

Developer analyzing JavaScript code on screen
JavaScript error in production with unreadable stack trace
Analyzing a minified JavaScript library to understand how it works
Debugging a performance issue in minified code
Legal reverse engineering of a third-party script
Learning by analyzing code from popular websites
Limitations of unminification

It's important to understand what unminification can and cannot do:

Limitations:

Renamed variables (mangling) cannot be restored: `a`, `b`, `c` will remain `a`, `b`, `c`
Deleted comments are permanently lost
Eliminated dead code cannot be recovered
Logical structure can be restored, but not original names
Some aggressive optimizations make code difficult to understand even after unminification

What works:

Restoration of indentation and formatting
Adding spaces around operators
Separating statements across multiple lines
General readability improvement
Facilitating debugging with DevTools

How to unminify JavaScript with FastMinify

Quick method: Online tool

The simplest and fastest way to unminify JavaScript is to use an online tool like FastMinify.
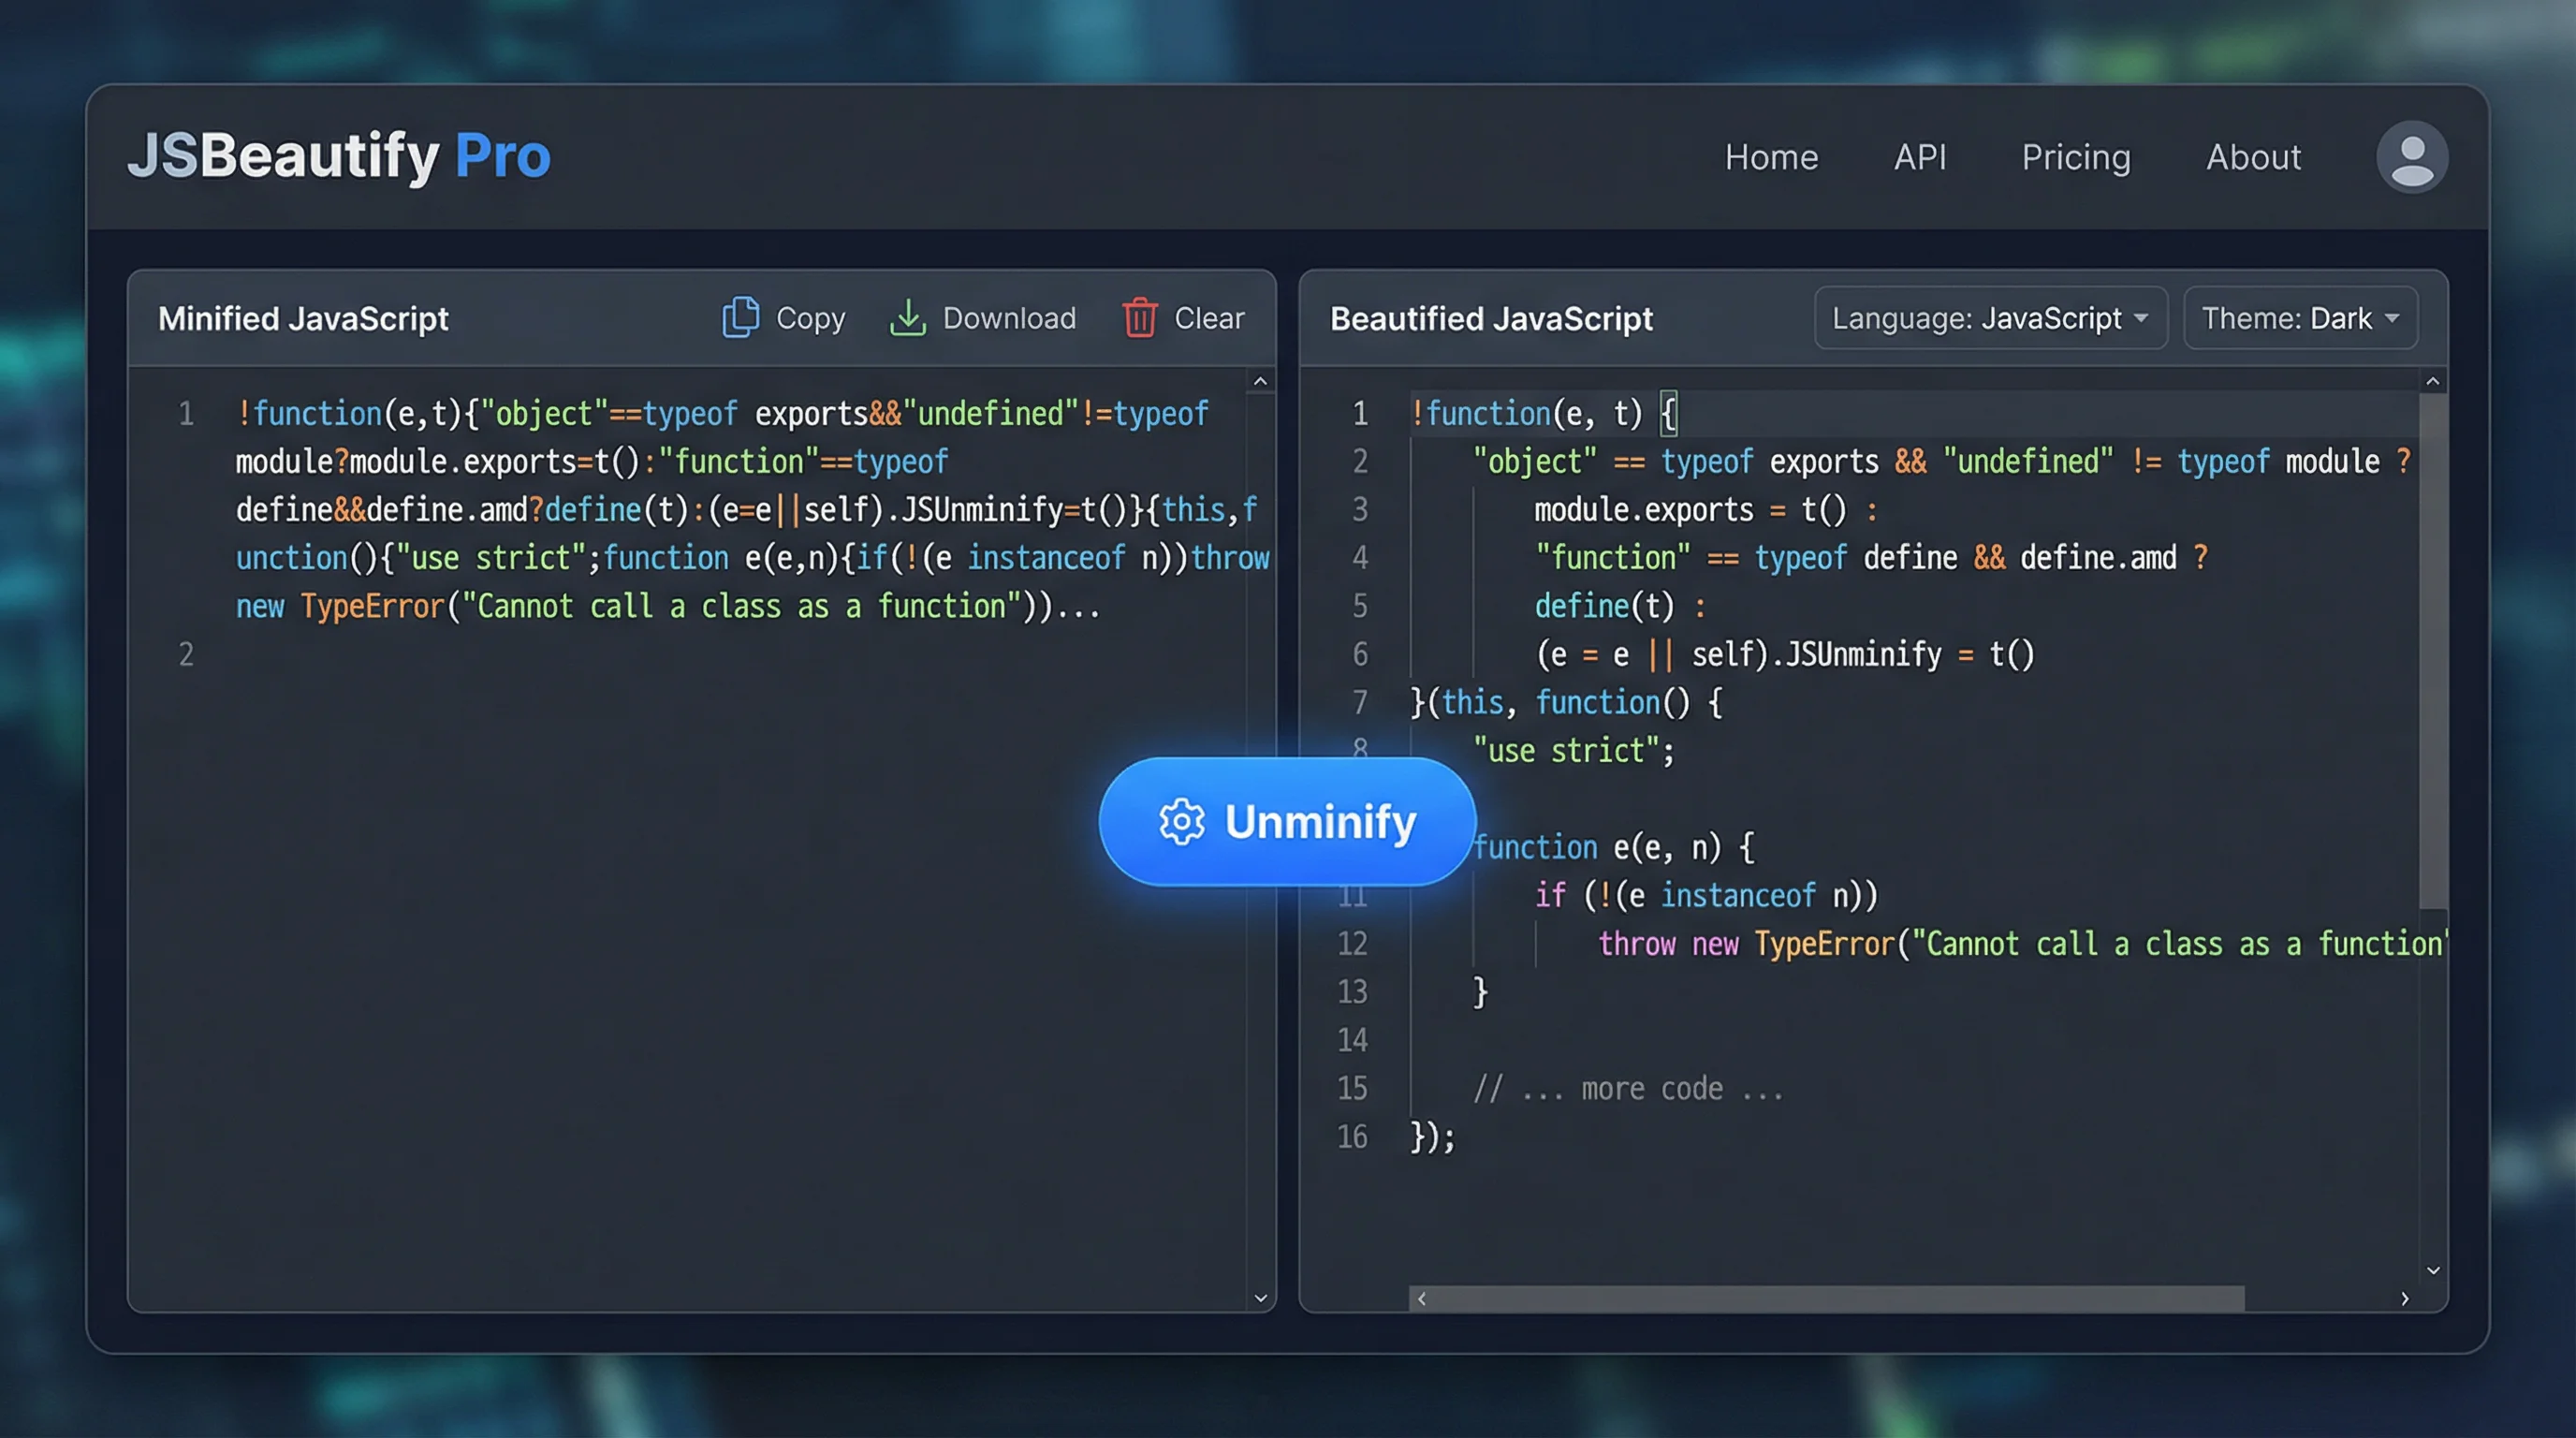
FastMinify tool interface for unminifying JavaScript

1
Copy the minified code

Copy the minified JavaScript code from the browser console, DevTools, or a source file.

2
Paste into FastMinify

Go to [FastMinify - Unminify JavaScript](https://fastminify.com/en/minify-js) and paste your code in the left editor.

3
Click "Unminify"

Select the "Unminify" option in the processing options. The formatted code will appear instantly in the right editor.

4
Copy the result

Copy the unminified code and use it for your debugging or analysis.

Example:

Before (minified):

function a(b,c){return b+c}const d=a(5,3);console.log(d);

After (unminified):

function a(b, c) { return b + c } const d = a(5, 3); console.log(d);
Real example: Debugging an error

Here's a real example of how to unminify code to debug an error:

Browser console displaying a JavaScript error

Minified code:

!function(e,t){"object"==typeof module&&"object"==typeof module.exports?module.exports=e.document?t(e,!0):function(e){if(!e.document)throw new Error("jQuery requires a window with a document");return ...

Unminified code (preview):

!function(e, t) { "object" == typeof module && "object" == typeof module.exports ? module.exports = e.document ? t(e, !0) : function(e) { if (!e.document) throw new Error("jQuery requires a window with a document"); return t(e) } : t(e) }("undefined" != typeof window ? window : this, function(e, t) { var n = [], r = e.document, i = n.slice, o = n.concat, s = n.push, a = n.indexOf, u = {}, c = u.toString, l = u.hasOwnProperty, f = {}, p = "2.3.1", d = function(e, t) { return new d.fn.init(e, t) }, h = /^[\s\uFEFF\xA0]+|[\s\uFEFF\xA0]+$/g; // ... rest of formatted code });

Using Source Maps for optimal debugging

What is a Source Map?

Source Maps are files that establish a mapping between minified code and original source code. This is the best solution for debugging minified code.

Diagram explaining how Source Maps work
Access to original source code with real variable names
Breakpoints directly in source code
Readable stack traces with original function names
Debugging as if the code wasn't minified
How to enable Source Maps in production

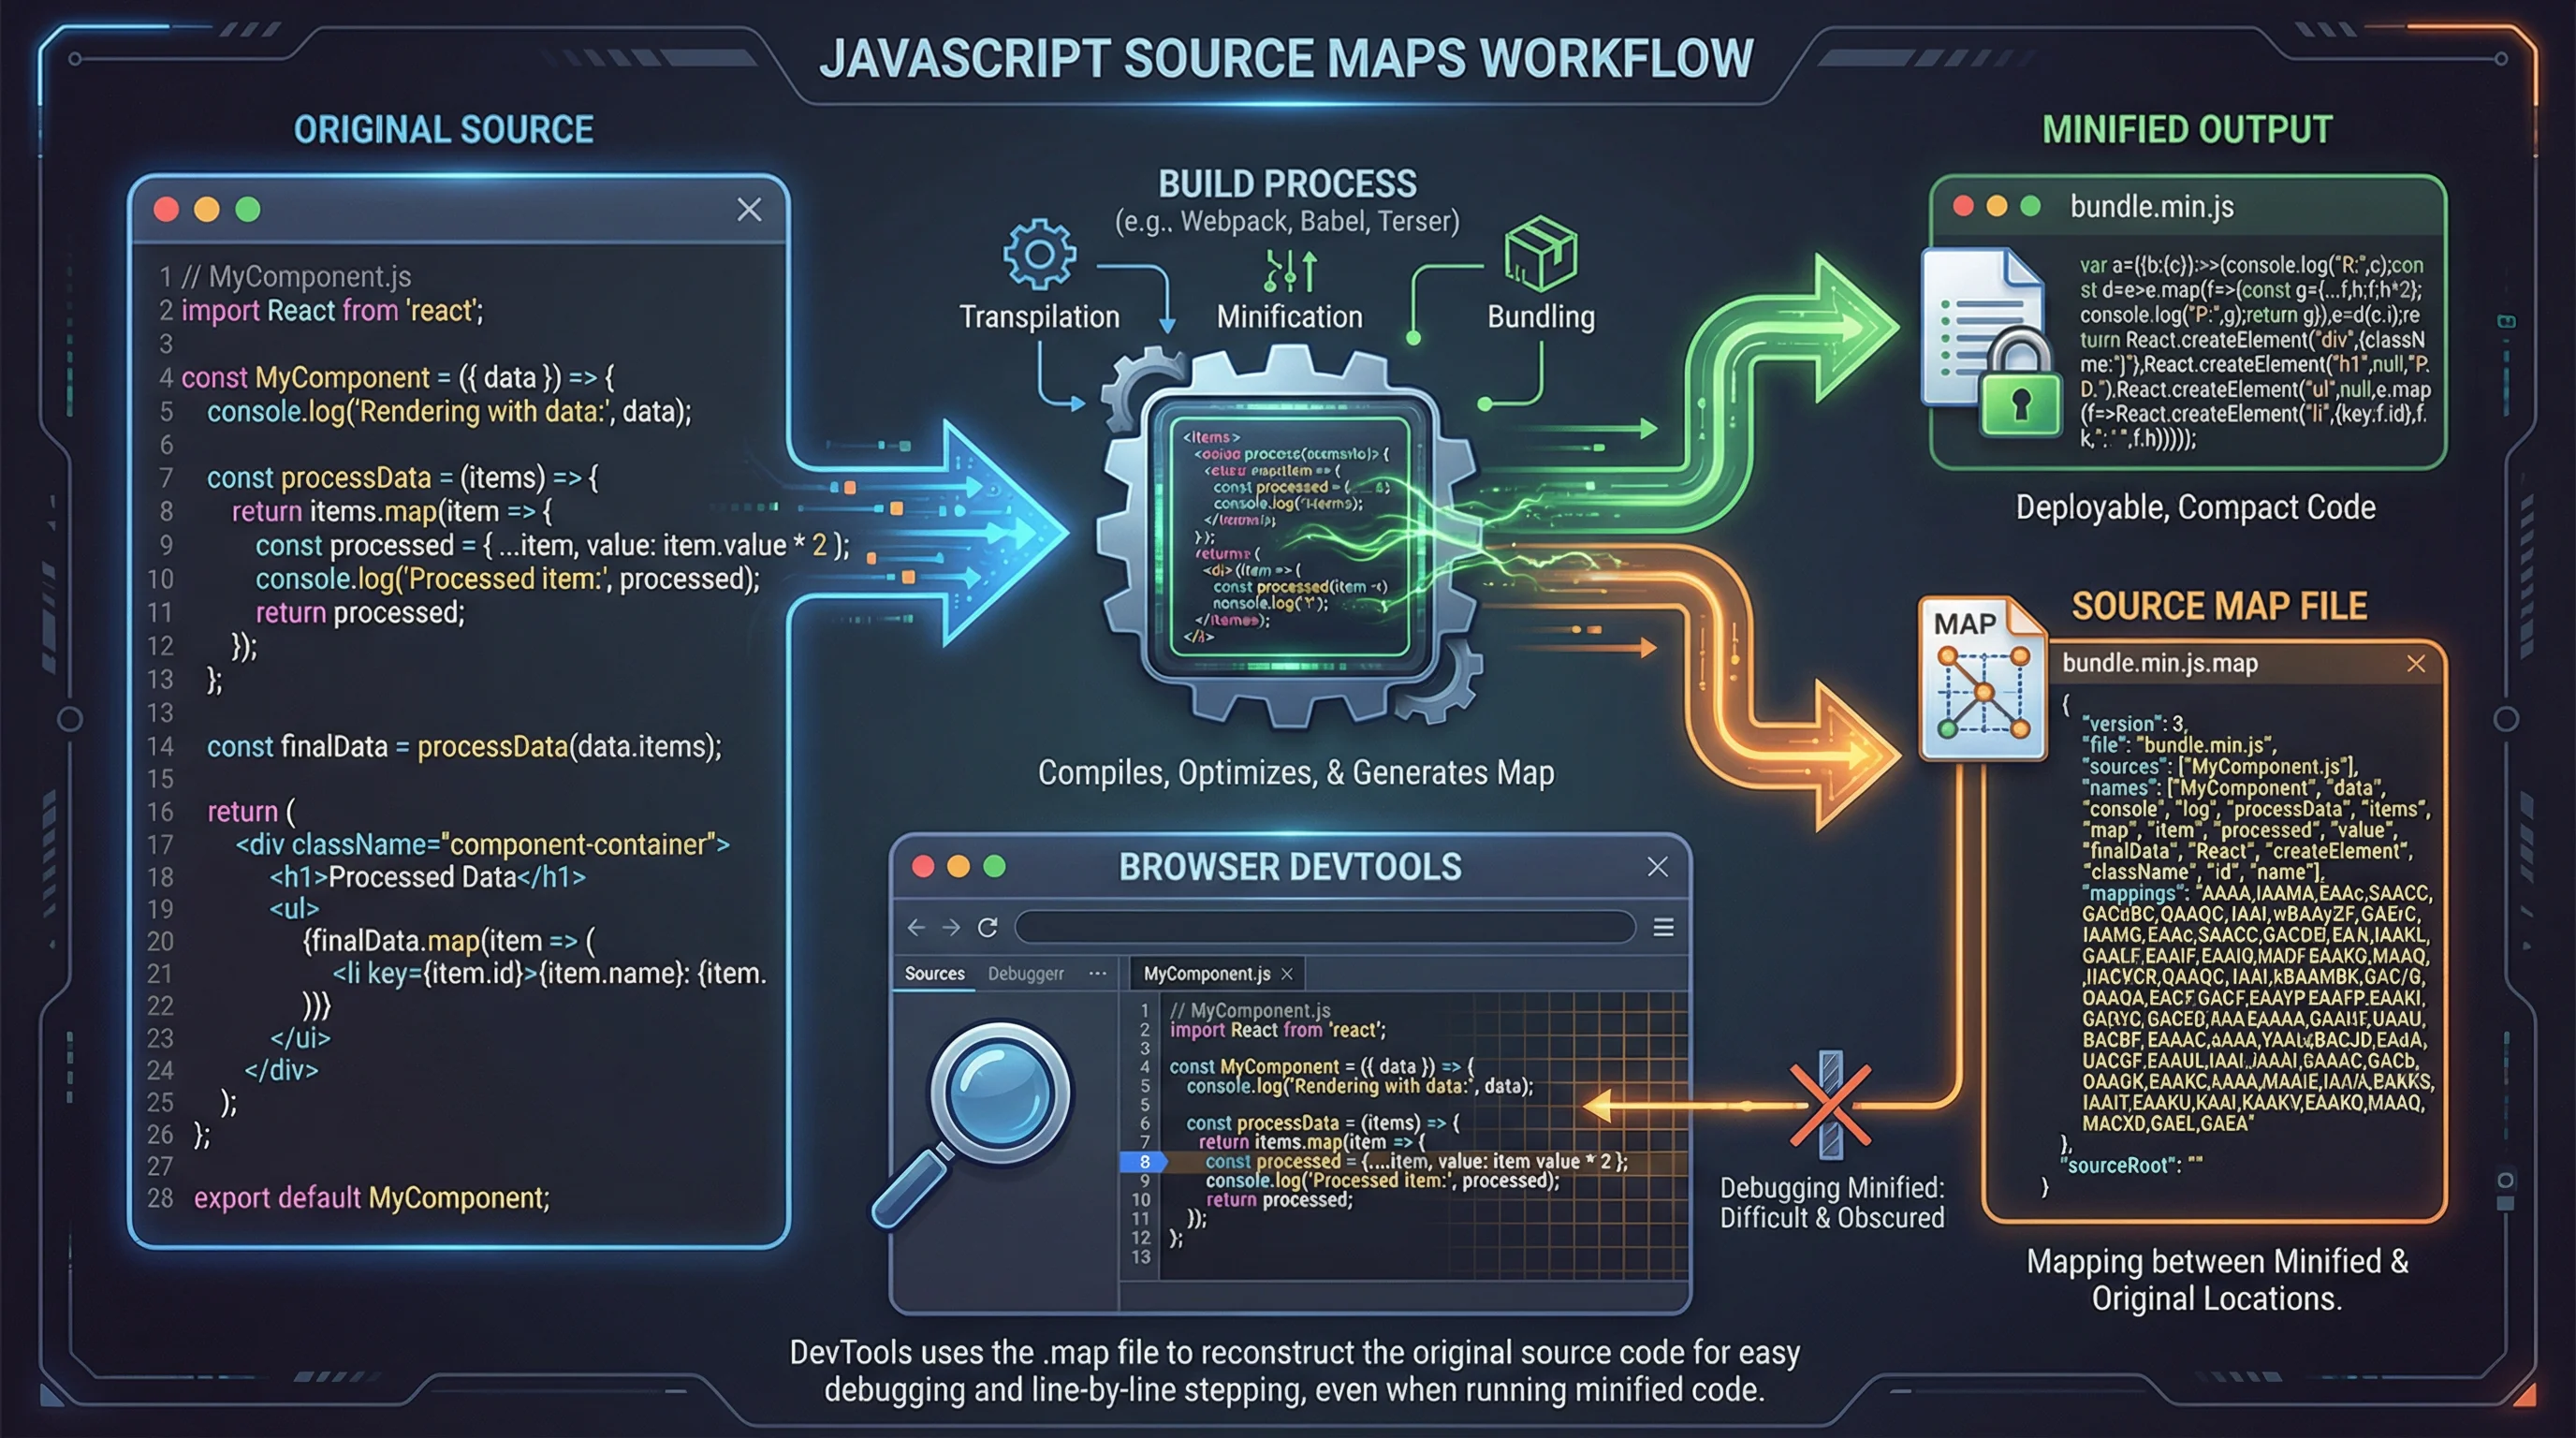
To enable Source Maps in your build:

Terser

const terser = require('terser'); const result = await terser.minify(code, { sourceMap: { filename: 'app.min.js', url: 'app.min.js.map' } });

Webpack

module.exports = { devtool: 'source-map', // For production // or 'hidden-source-map' to not expose publicly optimization: { minimize: true, minimizer: [new TerserPlugin({ sourceMap: true })] } };

Debugging with browser DevTools

Pretty Print in Chrome DevTools

Chrome DevTools includes a "Pretty Print" feature that automatically formats minified code.

Chrome DevTools with Pretty Print feature enabled
1
Open Chrome DevTools (F12)
2
Go to the "Sources" tab
3
Open the minified JavaScript file
4
Click the "{}" (Pretty Print) button at the bottom left
5
The code will be automatically formatted and more readable
Using breakpoints on unminified code

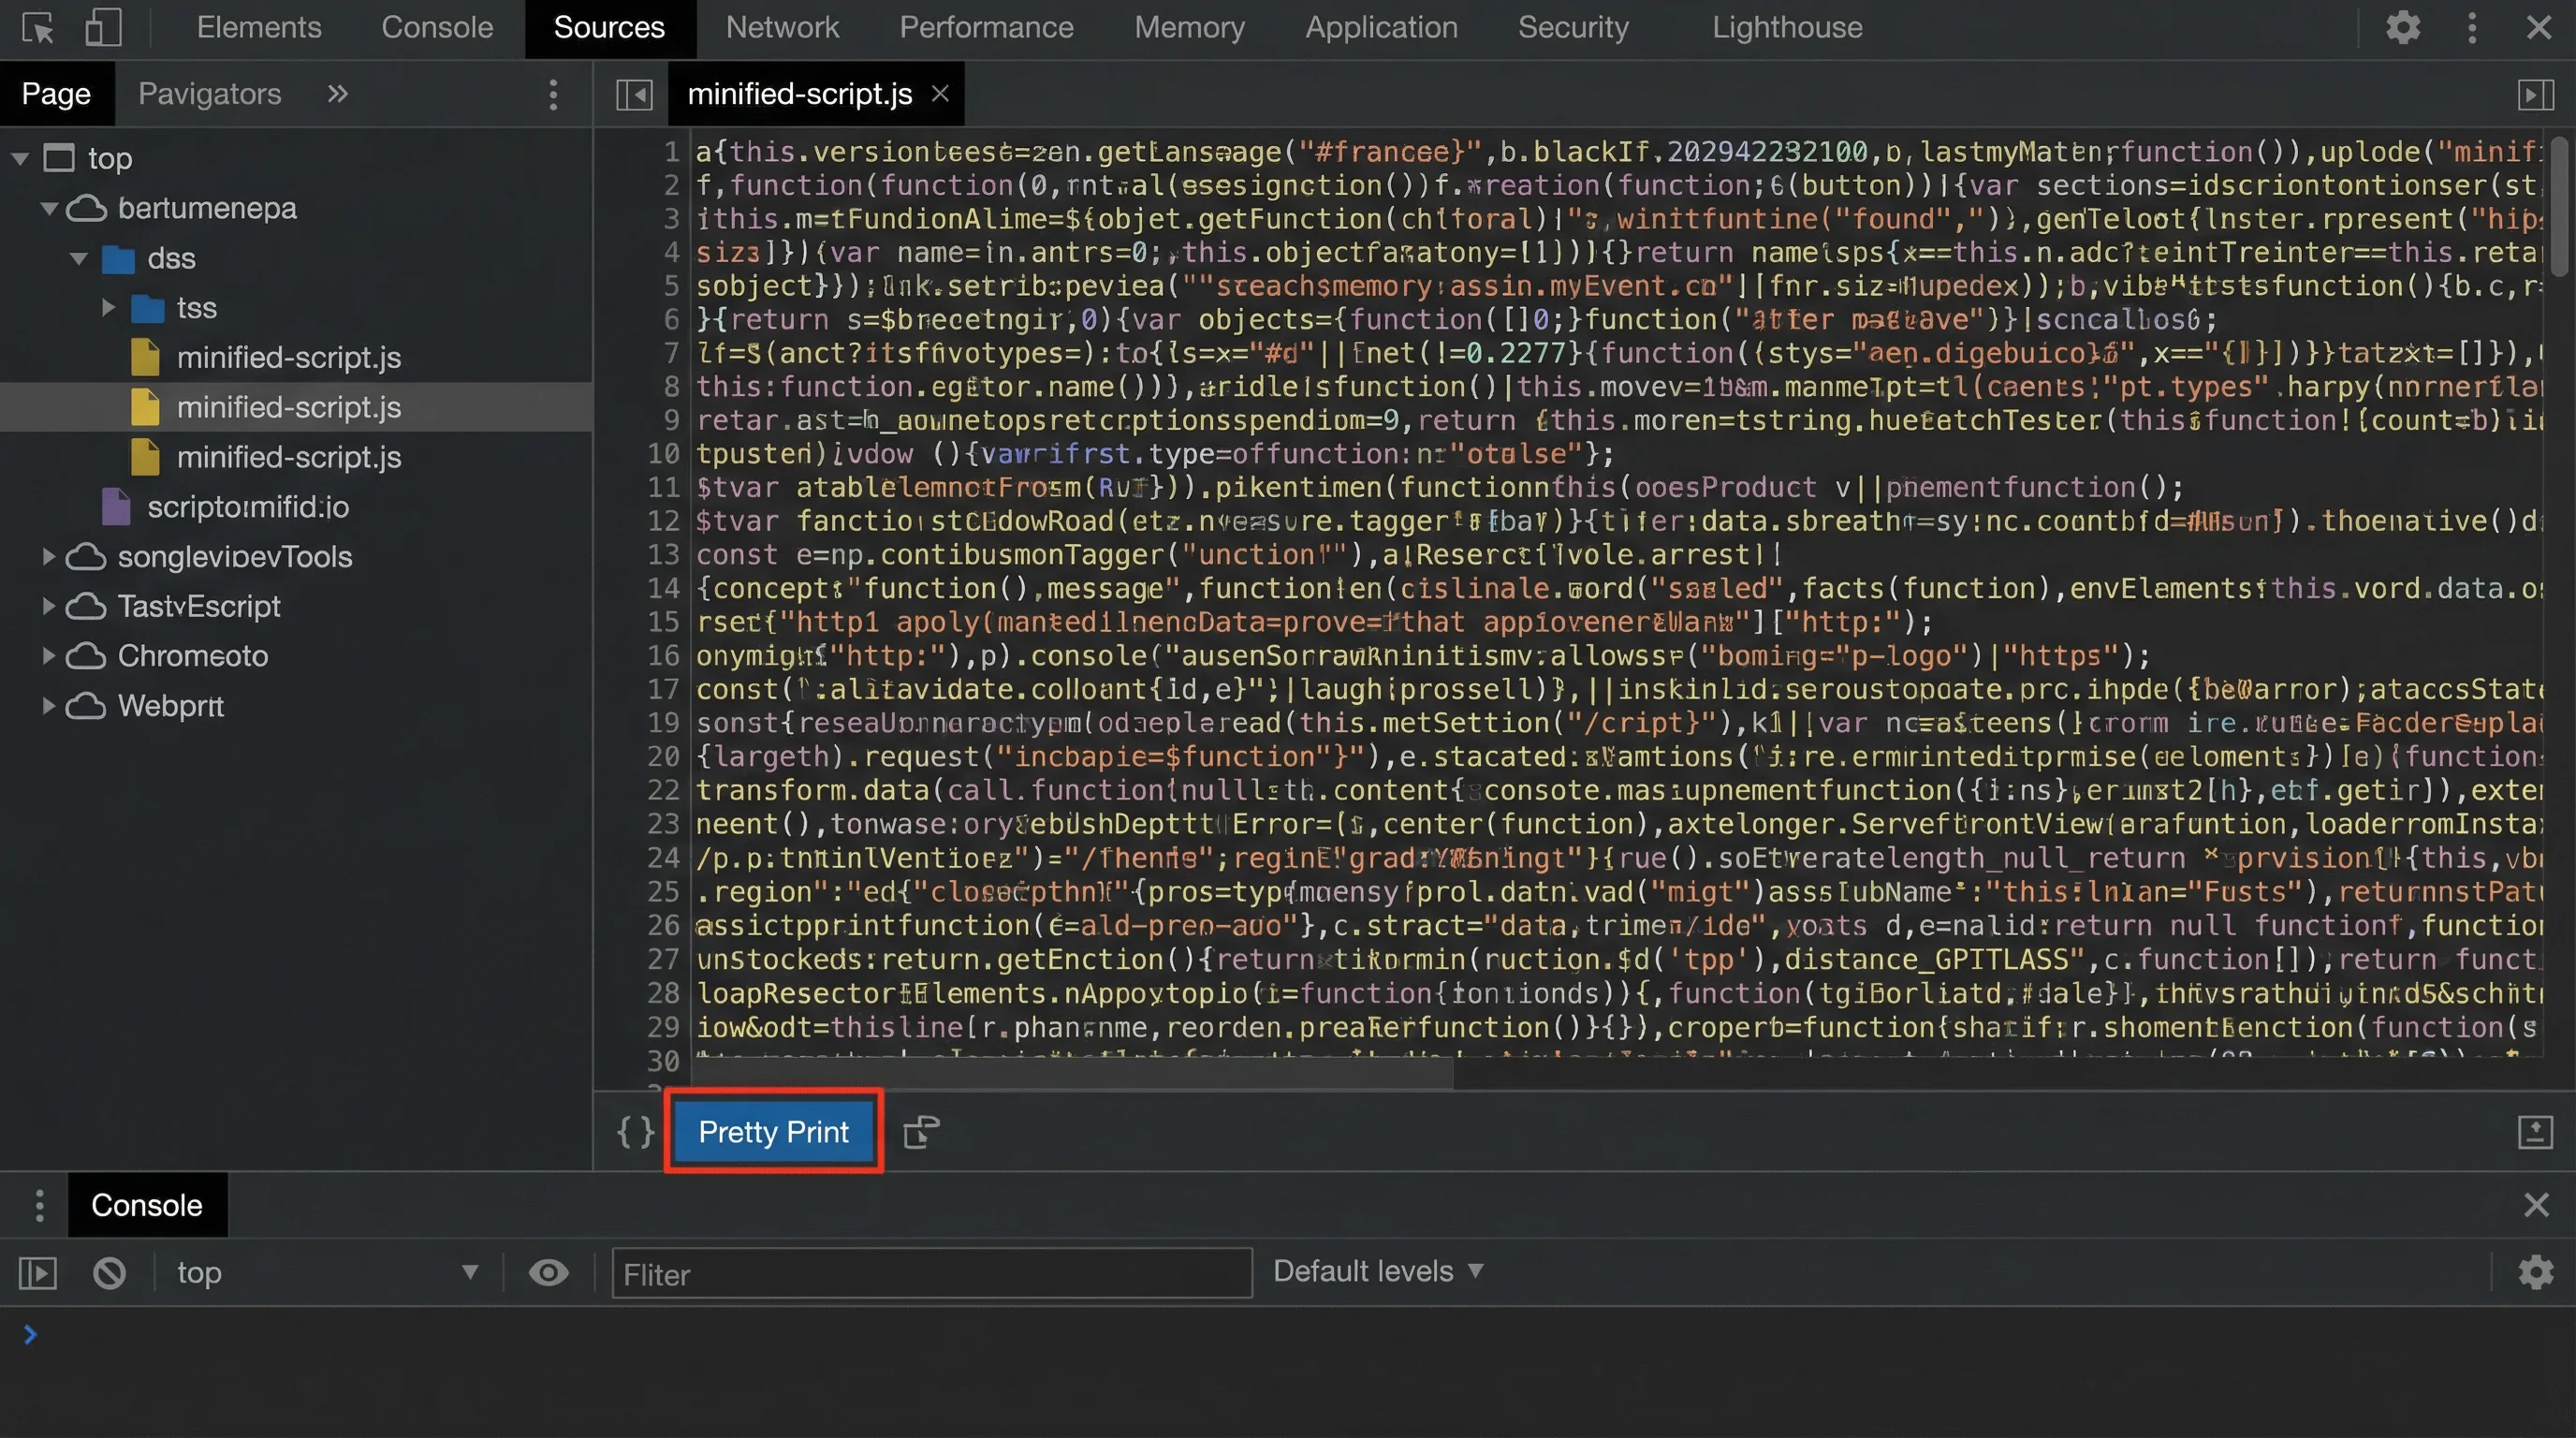
Once the code is unminified (via FastMinify or Pretty Print), you can:

Tips:

Place breakpoints on formatted lines
Inspect variable values (even if they're renamed)
Use the console to test expressions
Follow execution line by line with the debugger
Analyze the stack trace to understand execution flow

Best practices for debugging minified code

Effective debugging strategies

Here are proven techniques for effectively debugging minified code:

Developer using multiple debugging tools simultaneously
Use Source Maps if available (best solution)
Unminify code with FastMinify for an overview
Use console.log() strategically to trace execution
Analyze the stack trace to identify the problematic function
Compare behavior between minified and non-minified code in development
Identifying problems in unminified code

Even with renamed variables, you can identify problems:

Look for recognizable code patterns (if/else, for loops, function calls)
Use literal values (strings, numbers) as landmarks
Analyze object and array structures
Follow function calls to understand flow
Use DevTools to inspect values at runtime

Alternative tools for unminifying

Comparison of available tools

Several tools allow you to unminify JavaScript. Here's a quick comparison:

FastMinify

Free, fast online tool with no registration required. Also supports minification and beautify.

Pros:
Free
Fast
No installation
Simple interface

JS Beautifier

Popular open-source tool for formatting and unminifying JavaScript.

Pros:
Open-source
Available online and CLI
Highly configurable
Cons:
Less modern interface

Prettier

Popular code formatter that can also format minified code.

Pros:
Industry standard
IDE integration
Multi-language support
Cons:
Requires installation
Less specialized for unminification

Conclusion

Unminifying JavaScript is an essential skill for any developer working with production code. Whether you use FastMinify for a quick solution, Source Maps for optimal debugging, or browser DevTools, the important thing is understanding how to transform unreadable code into understandable code. Remember: the best solution remains having Source Maps in production for optimal debugging.

Try our free tool to unminify your JavaScript now

Use FastMinify to quickly unminify production code
Configure Source Maps in your build workflow
Learn to use DevTools for debugging
Document your debugging processes for your team
Always test with non-minified code in development
Share this article
Share this article:
How to Unminify JavaScript for Debugging (Readable Output)